A method for determining areas as a function of depth
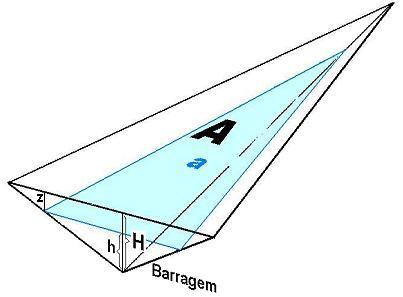
When it is desirable to calculate what area of a hydroelectric reservoir occupies the strip whose depth ranges from zero to a given depth, for example the strip with depth ranging from zero to 20m, you can use the method here presented called the inverted pyramid. This method uses as a reservoir model the “inverted pyramid” of the figure, and it is necessary to know the size of surface area A and dam depth H. Although the model is very simple, there has been reasonable agreement with known areas, determined by topography.
Assuming the water surface area to be A when the dam depth is H is is possible to calculate the area a that the water surface (colored in the figure) would have for depth h. It is easy to show that area a is proportional to the square of depth h, in other words
a = c x h2,
where c is the proportionality constant. This constant is:
c = A/H2
In the following lines, by specifying z as the depth limit until where there is bubble emission, the area a will be identified as the area that does not emit bubbles.
After it is possible to calculate, by difference, the area S that emits bubbles, bounded by the shore and depth z. From bubble emission measurements maximum depth z is determined until where bubble emissions occur and h is calculated being h=H–z. The area S which emits bubbles with then be S=A–a, or
S = A – (A/H2)xh2.
Application of this method to two reservoirs:
1 – Tres Marias reservoir (on the São Francisco river, A=1009,32(km)2, H=50,2m). Assuming there is bubble emission from the shore to a depth of z= 23,3m, h= 26,9m is found and the bubble emitting area S=719,50(km)2 is calculated, to be compared with the known area, calculated from map contour lines, of 693,57(km)2. An overestimatimation of 3,7% is noted.
2- Tucuruí reservoir(on the Tocantins river, A=2430(km)2, H=65,5m). Assuming there is bubble emission from the shore to a depth of z=20,4m, h= 45,1m is found and the bubble emitting area S=1278(km)2, to be compared with the known area, calculated from map contour lines, of 1502,35(km)2. An underestimatimation of 15% is noted.

